
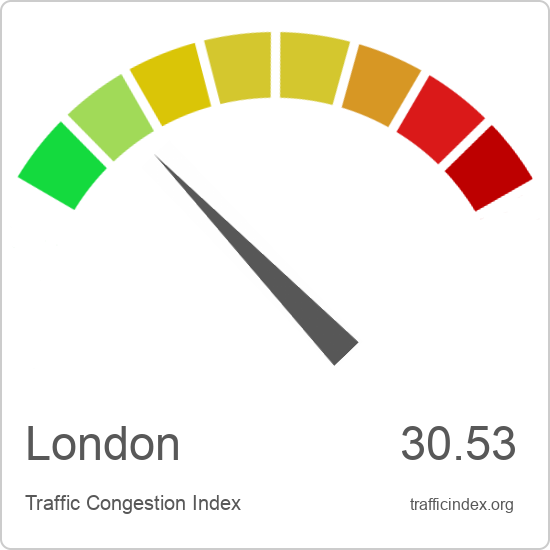
Traffic Congestion in London
 United Kingdom
| Average | Min | Max | |
| Last 7 days | 54.88 | 16.99 | 94.73 |
| Last 30 days | 58.89 | 16.90 | 109.41 |
| Last 90 days | 55.97 | 13.37 | 111.49 |
Nearby Locations
 |
Traffic Index in Paris | 39.92 |
 |
Traffic Index in Brussels | 16.04 |
 |
Traffic Index in Dublin | 41.32 |
 |
Traffic Index in Munich | 27.69 |
 |
Traffic Index in Milan | 24.79 |
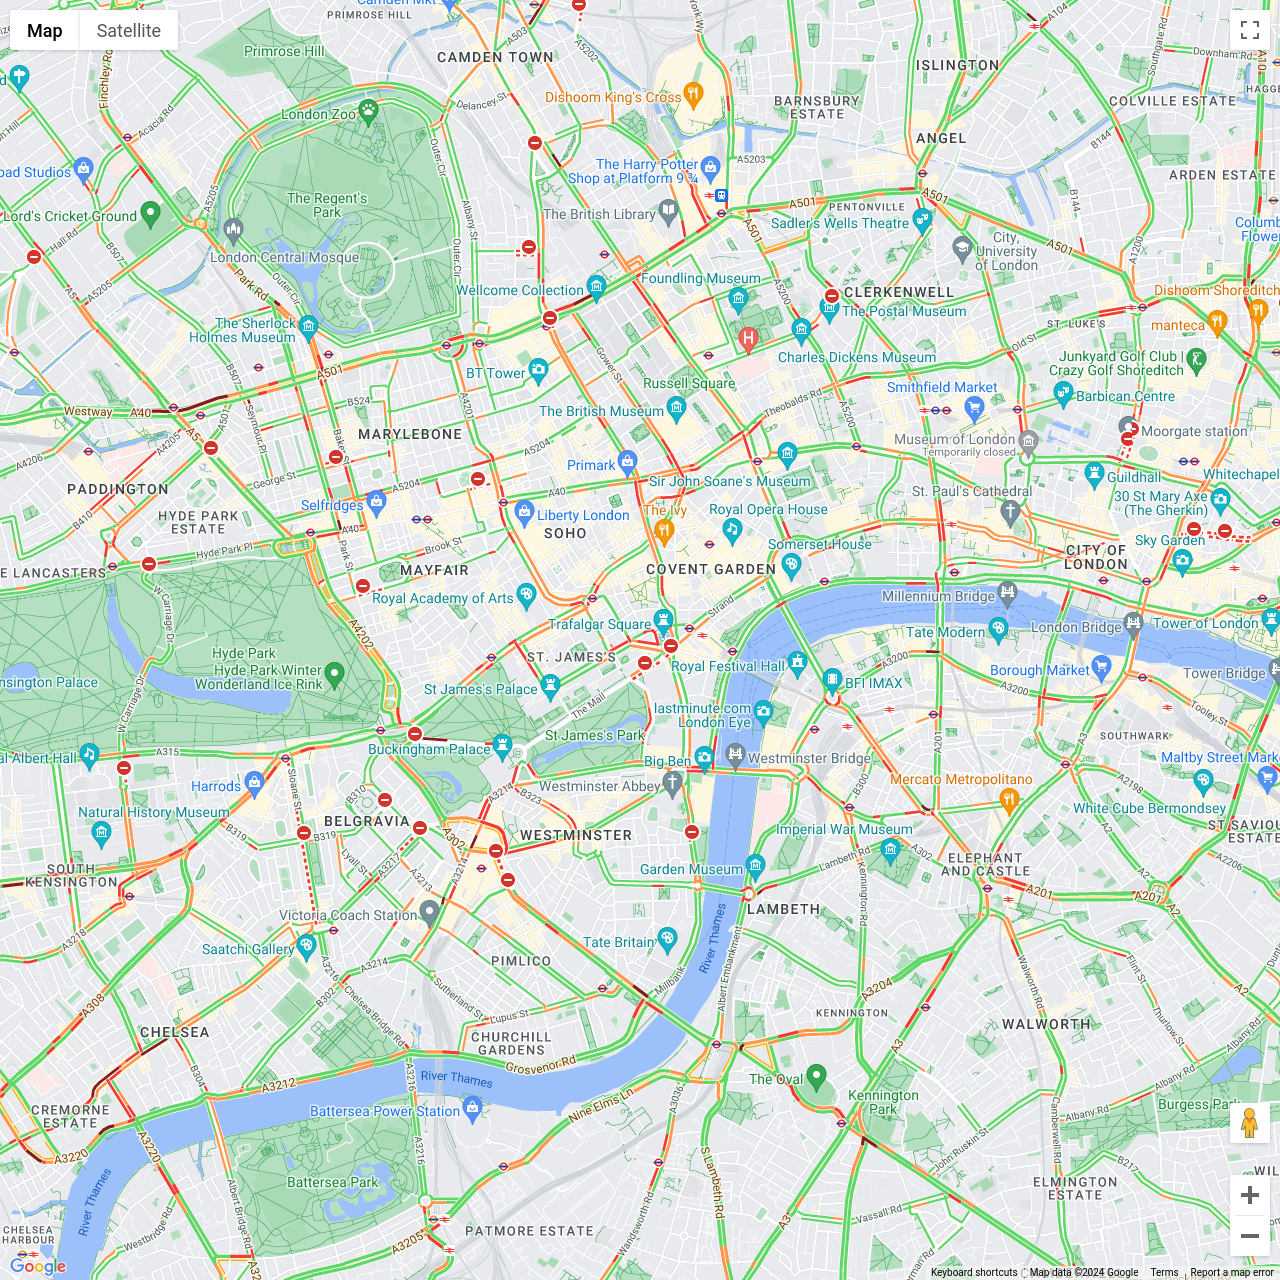
Real-time Traffic Congestion in London
(2017 - 2026)
(2017 - 2026)
Subscription required
To access this chart, a Premium subscription is required. Click for details.
Daily Traffic Congestion in London
(2017 - 2026)
(2017 - 2026)
Subscription required
To access this chart, a Premium subscription is required. Click for details.
Monthly Traffic Congestion in London
(2017 - 2026)
(2017 - 2026)
Subscription required
To access this chart, a Premium subscription is required. Click for details.
How congested is London?
With an average TCI of 58.89 in the previous 30 days, London is currently sitting on position 1 in our Global Traffic Congestion Rankings. The worst traffic congestion is currently recorded in London (58.89), Paris (53.8), Bangkok (51.1).
What time is rush hour in London?
The heaviest traffic congestion in London is usually observed around H11:00 and H12:00, a period characterized as rush hour, resulting in prolonged and widespread traffic delays throughout the city.