Traffic Congestion in Helsinki
Average | Min | Max | |
Last 7 days | 24.66 | 7.28 | 52.78 |
Last 30 days | 25.59 | 7.23 | 82.93 |
Last 90 days | 22.46 | 1.66 | 82.93 |
Nearby Locations
Traffic Index in Riga | 22.20 | |
Traffic Index in Saint Petersburg | 61.84 | |
Traffic Index in Vilnius | 23.46 | |
Traffic Index in Stockholm | 23.58 | |
Traffic Index in Warsaw | 57.17 |
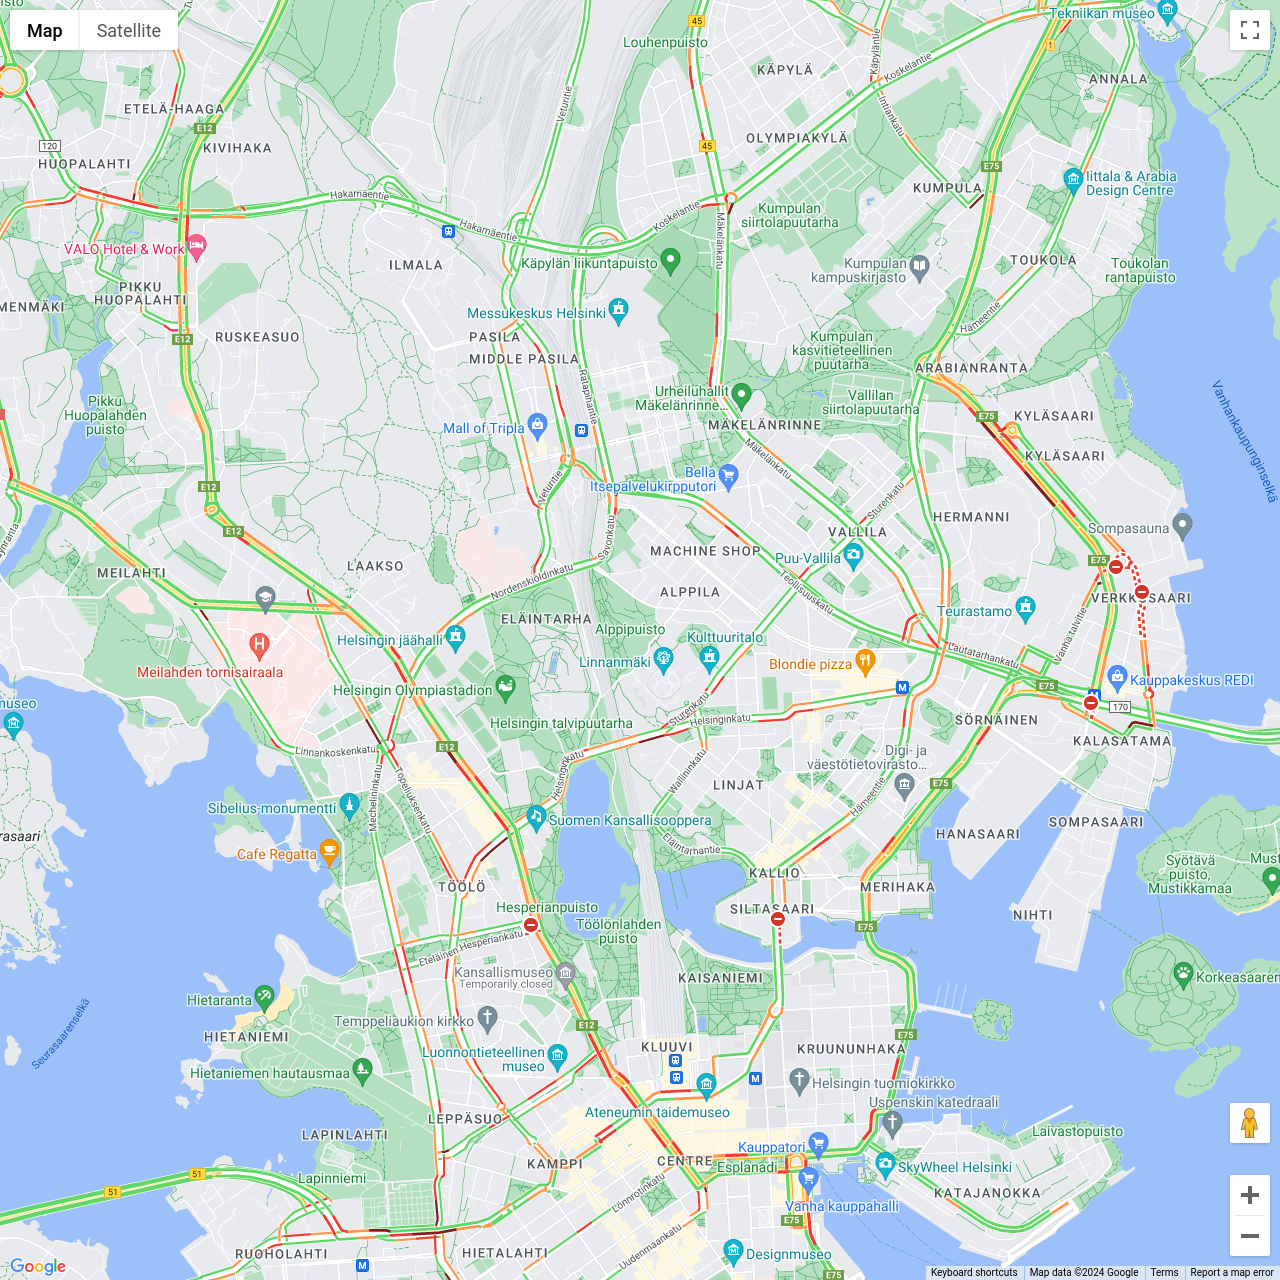
Real-time Traffic Congestion in Helsinki
(2017 - 2024)
(2017 - 2024)
Subscription required
To access this chart, a Premium subscription is required. Click for details.
Daily Traffic Congestion in Helsinki
(2017 - 2024)
(2017 - 2024)
Subscription required
To access this chart, a Premium subscription is required. Click for details.
Monthly Traffic Congestion in Helsinki
(2017 - 2024)
(2017 - 2024)
Subscription required
To access this chart, a Premium subscription is required. Click for details.
How congested is Helsinki?
With an average TCI of 25.59 in the previous 30 days, Helsinki is currently sitting on position 36 in our Global Traffic Congestion Rankings. The worst traffic congestion is currently recorded in New York City (48.19), Paris (45.5), London (44.97).
What time is rush hour in Helsinki?
The heaviest traffic congestion in Helsinki is usually observed around 15:00 and 16:00, a period characterized as rush hour, resulting in prolonged and widespread traffic delays throughout the city.